So, you want to use Microsoft’s Power BI but don’t know where or how to start?
Posted on January 6, 2025 by Tatania Riley

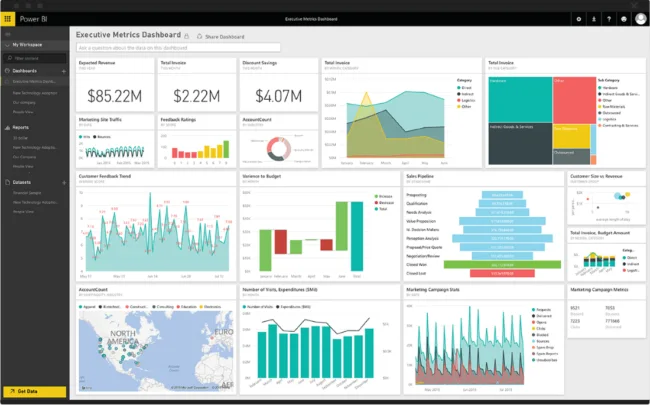
Power BI integrates multiple sources of your real-time data into one visually clear and appealing dashboard, enabling you to make evidence-informed decisions you can rely on with confidence. By gaining a clear understanding of how you are performing, you can improve your business intelligence.
In today’s world the amount of data available is greater than ever, but that leaves us with a real challenge – how do you focus down on the numbers that really drive your decisions and activities?
Whether you have financial information from your accounts application, customer data from a CRM platform, Google Analytics data about who’s visiting your website, or stock level trends from ERP software, Power BI can seamlessly integrate it all. Furthermore, the data is presented in a way that anyone in the organisation can piece together and understand, not just database admins.
Sound too good to be true? Well, there is no catch just some aspects and questions you need to wrap your head around first before you jump into the deep end of data.
Start small and grow
You may be tempted to jump in and create a report for everything you think you’ll ever need, but this can lead to losing focus on the key information you actually require. Or it can become such an overwhelming project that you give up, because it seems impossible to complete.
By starting small with a core set of reports focused on your vital data, you can produce valuable insights, which can drive greater adoption and appreciation of Power BI.
Power BI is incredibly powerful and in time you’re likely to end up with many, many reports which deliver insights across your whole organisation. But don’t be tempted to try to initially specify every report you think you’ll need. You’ll end up developing lots of reports that you don’t actually need, and missing out on many that you do, and it’s a project that may never start, let alone finish.
It’s better to start with a core set of reports that are currently time consuming to produce manually. By focusing on these initial priorities, you can highlight the platform’s impact and build confidence in its use. Over time, as you grow familiar with Power BI and your organisation requirements change, you can gradually expand your efforts.
Power BI Desktop for single users is free! But you need Pro if you’re going to share securely
It’s amazing that Power BI Desktop is completely free! For a single user who might only need to share static reports in PDF format it’s great, but you will need Power BI Pro licensing for all users who are consuming reports if you want those reports to remain interactive, and secure.
Don’t be tempted to use the ‘Publish to web’ feature in Power BI Desktop, as this makes your report available publicly, generating a public URL and embed code. Even Microsoft have a clear warning in their documentation about this, and it has been the cause of several major data breaches around the world.

Multiple data sources
Take advantage of Power BI’s ability to bring together multiple different data sources, such as Excel spreadsheets, SharePoint lists, SQL databases and data from cloud systems through APIs. The real power comes from linking data sources in your model and then manipulating them to allow you, or your users, to produce the reports you need.
Build a good data model, following best practice, as early mistakes can come back to haunt you later
Power BI makes it easy to bring together lots of data from different sources and manipulate it, but this isn’t without risks. Building on top of a solid data model will make life easier when the amount of data, and different sources of data grow. Early mistakes can result in performance issues, errors, complex management or even situations where it becomes nearly impossible to produce the reports you want in the future. Make sure you’re investing in a solid data model, built on solid foundations and best practice, and get help from experts if you need it.
Consider security of the data
Is it appropriate for everyone to see all of the data? If not, Power BI offers multiple ways to keep your data secure. With the Power BI service, included in the Power BI Pro license, workspaces and reports can be shared with specific users or groups using Microsoft 365 permissions. You can even restrict access down to specific rows of data, so for example, although your data model contains all of the data, users from different departments can only see their data.

Not everyone processes data the way you do!
Consider the audience for your reports, you might be very visual and love colourful high-level bar charts, but some prefer information in tabular format so they can see the detail. There’s no reason you can’t create reports with the same data shown in multiple ways for different audiences! Don’t be offended when you show someone your beautiful, vibrant, colourful charts, only for them to ask if they could have a table. you can still use sophisticated conditional formatting to make the data engaging!
Conclusion
If you are looking for a new and improved way to digest and visualise your data in a clean and sleep way, Power BI is the tool for you. Power BI is powerful but flexible, so you are able to transform your organisations raw date into actionable insights. By starting small, focusing on key metrics, and following best practices for data modelling and security, you will be able to unlock its full potential. If you are ready to revolutionise your approach to data, Power BI is the perfect place to start.

