Python In Excel Brings Increased Computing Power

Posted on February 17, 2025 by Rob May
Welcome to our technical blog, where we share insights and expertise on a variety of technical topics. This post is part of our ongoing series, specifically aimed at professionals in technical roles, providing in-depth information and practical tips.
Python is a popular foundational coding language, used by everyone from schools to developers. It is commonly used for task automation, data analysis and data visualisation, as well as developing web applications. As it’s easy to learn, non-developers can pick up the basics quickly for their needs.
Microsoft Excel now lets you use Python code directly in spreadsheet cells, meaning you can combine Excel’s familiar interface with Python’s powerful data analysis capabilities without switching between different programs.
For Excel users who were previously having to find a way to run Python to execute data analysis or visualisation without any integration or use the less secure VBA (Visual Basic for Applications) in Excel, this new option from Excel paves a more secure way forward.
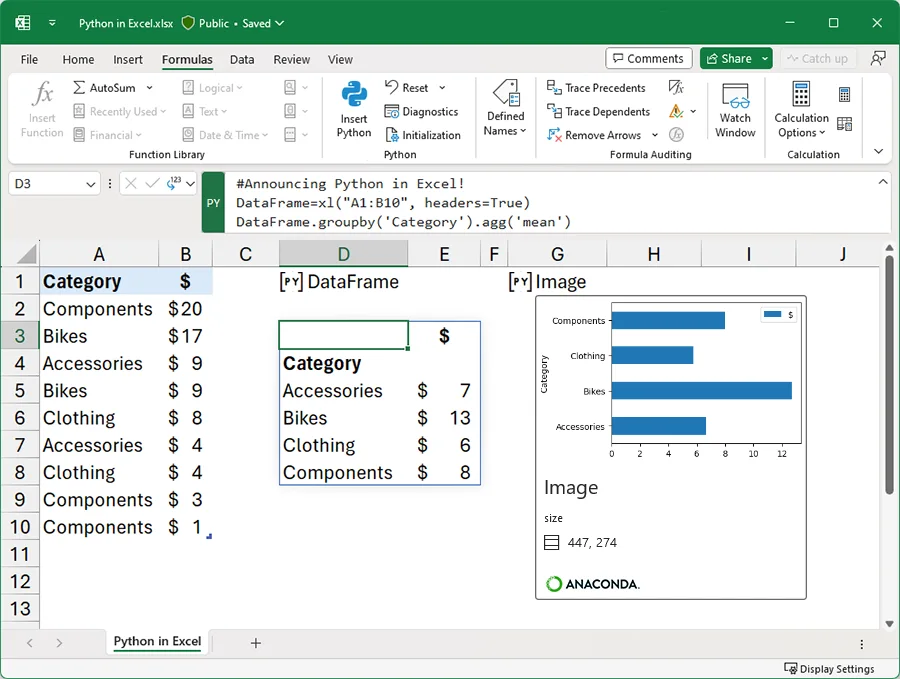
What does the Python and Excel integration do?
When using Python in Excel, you can easily work with Excel’s different parts – like cells, ranges, tables and more – right in your Python code. This means you could, for example, grab data from a specific range of cells, run calculations on a table, or work with named ranges you’ve already set up in Excel. One of the really useful features is that you can choose whether to get your results as Python data that you can work with further or have them show up directly in Excel cells.
While you can bring in outside data using Power Query, many of Python’s usual data import tools won’t work in Excel. This might be a bit limiting if you’re used to working with Python libraries like pandas to import data, but Power Query is quite powerful in its own right.
As for how calculations work, Excel runs Python code row-by-row, and you can pause automatic calculations by switching to Partial or Manual Calculation modes if you need to. This can be particularly helpful when you’re working with large spreadsheets or complex calculations and want to control exactly when things get updated.
How to use Python in Excel
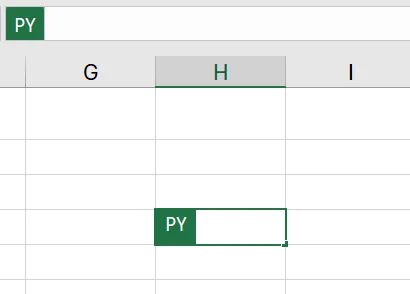
To use Python in Excel, either select a cell and on the Formulas tab, select Insert Python, or on a cell, type “=PY(“. This allows you to begin to insert the code required into that cell. Once Python is enabled in a cell, that cell displays a PY icon. The formula bar displays the same PY icon when the Python cell is selected.
Python uses the custom Python function xl() to communicate between Python and Excel. This allows you to combine the need for Python and Excel in one formula. Take a look at the example below:
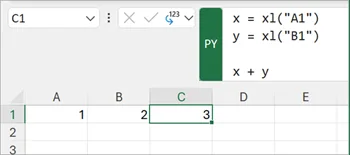
Here, x and y are Python functionality, and the xl function allows the user to reference Excel cells A1 and B1. Cell C1, where the Python formula is contained, then shows the result of x+y.
Why would you use the Python and Excel integration?
While Python and Excel separately have their leading features, together they offer a wide range of options that enhance the existing Excel functionality.
By being able to use some of Python’s libraries (a term used in development to mean a collection of features, often to provide a specific function such as data visualisation or statistical modelling), users can enhance what Excel already does to get the most from their work.
Advanced data visualisation
Data visualisation is already possible with Excel’s basic functionality, but the Python integration takes it to the next level. A wide variety of graphs not previously available can now be used such as histograms, box plots and violin plots.
Complex calculations
By using Python libraries, statistical analysis and calculations can be executed after one simple command. This reduces the amount of time spent calling on Excel formulas and reduces the requirement for exporting data into Python or running other programs to analyse data.
Copilot and Python in Excel
To allow users to get the most out of Excel, Microsoft is running a limited-capacity program of Copilot and Python in Excel. Here’s how you can use it:
- Open Excel on Windows and load your data.
- Navigate to the Home tab, then select Copilot.
- Select the Advanced analysis card in the task pane that opens
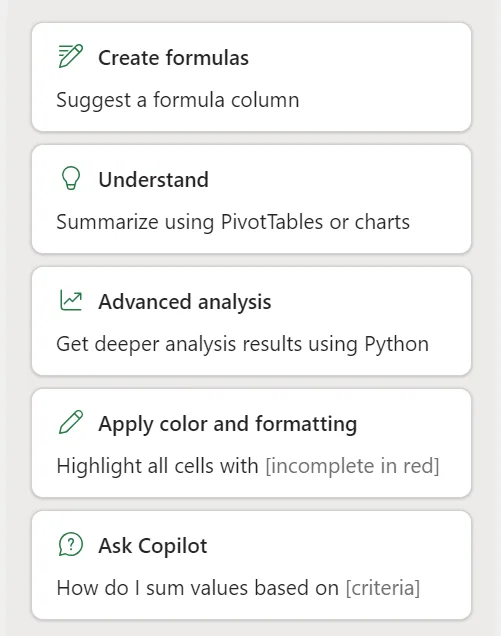
- Select ‘Start Advanced Analysis’ to enter advanced analysis mode. Copilot will then create and run any Python code required.
Controversy over Python integration running in the cloud
While the features announced were initially well received, users soon realised that the Python functionality was run in the cloud, specifically on one of Microsoft’s servers. While at face value this doesn’t seem like an issue, it allows Microsoft to effectively rate limit how much Python users can have.
This revelation has raised concerns among some users, as there is a monthly cap on the number of calculations that can be performed before the feature is disabled. To reactivate the feature, users are required to pay an additional fee.
This limitation has led some to perceive the integration as a free trial rather than a comprehensive feature. Microsoft has argued that the cap is necessary to prevent excessive server utilisation, but critics have suggested that an alternative approach would be to use the user’s local computer for processing.
Availability of Python in Excel
Currently Python in Excel is rolling out to Excel for Windows first and is starting with Enterprise plans. The latest availability can be found here.
Python in Excel pricing
While the main Python in Excel feature is part of Enterprise pricing, as we mentioned above, there was some controversy around the fact an add-in was in place to provide increased computing.
The Python in Excel add-on is available at either £19.68 per user, per month or £196.89 per, user, per year, excluding VAT.
Get started with Python in Excel today
As organisations navigate the evolving landscape of data analysis tools, the Python in Excel integration presents both opportunities and considerations. While the feature set is impressive, the cloud-based implementation and associated costs require careful evaluation of your organisation’s needs and usage patterns.
ramsac’s Microsoft consulting services can help you make informed decisions about implementing Python in Excel within your enterprise environment. Our experts can assess your specific requirements, provide guidance on cost-effective usage strategies, and ensure your team maximises the benefits of this powerful integration while maintaining data security and operational efficiency. Contact our team today to learn how we can support your organisation’s data analysis capabilities through strategic technology adoption.