How much does the UK spend on standby electronics in 2022?

Posted on September 27, 2022 by Louise Howland
Energy bills rising across the UK has contributed to a cost-of-living crisis that many households must now combat and find new ways of making their money go further.
In the modern world, electronics such as TVs, computers, and chargers are left plugged into the mains, resulting in a constant use of electricity that contributes to a higher energy bill. Standby electronics, according to data from Cambridge University, sits at 7.5% of an electricity bill. For the average household this could be up to £57 a year.
While using standby mode is an easier way to use technology, the cost of leaving electronics on standby, where they are not actively used but not switched off, is becoming increasingly expensive.
It’s time to start going from standby to shut down.
So, what part of the UK is spending the most on standby energy bills? In brand new research, we have discovered how much households around the country spend on standby electronics.
Find out if you’re in a standby hotspot below by hovering your mouse over the map.
Overall spend on standby electronics
Average household spend on standby electronics
How does the UK compare?
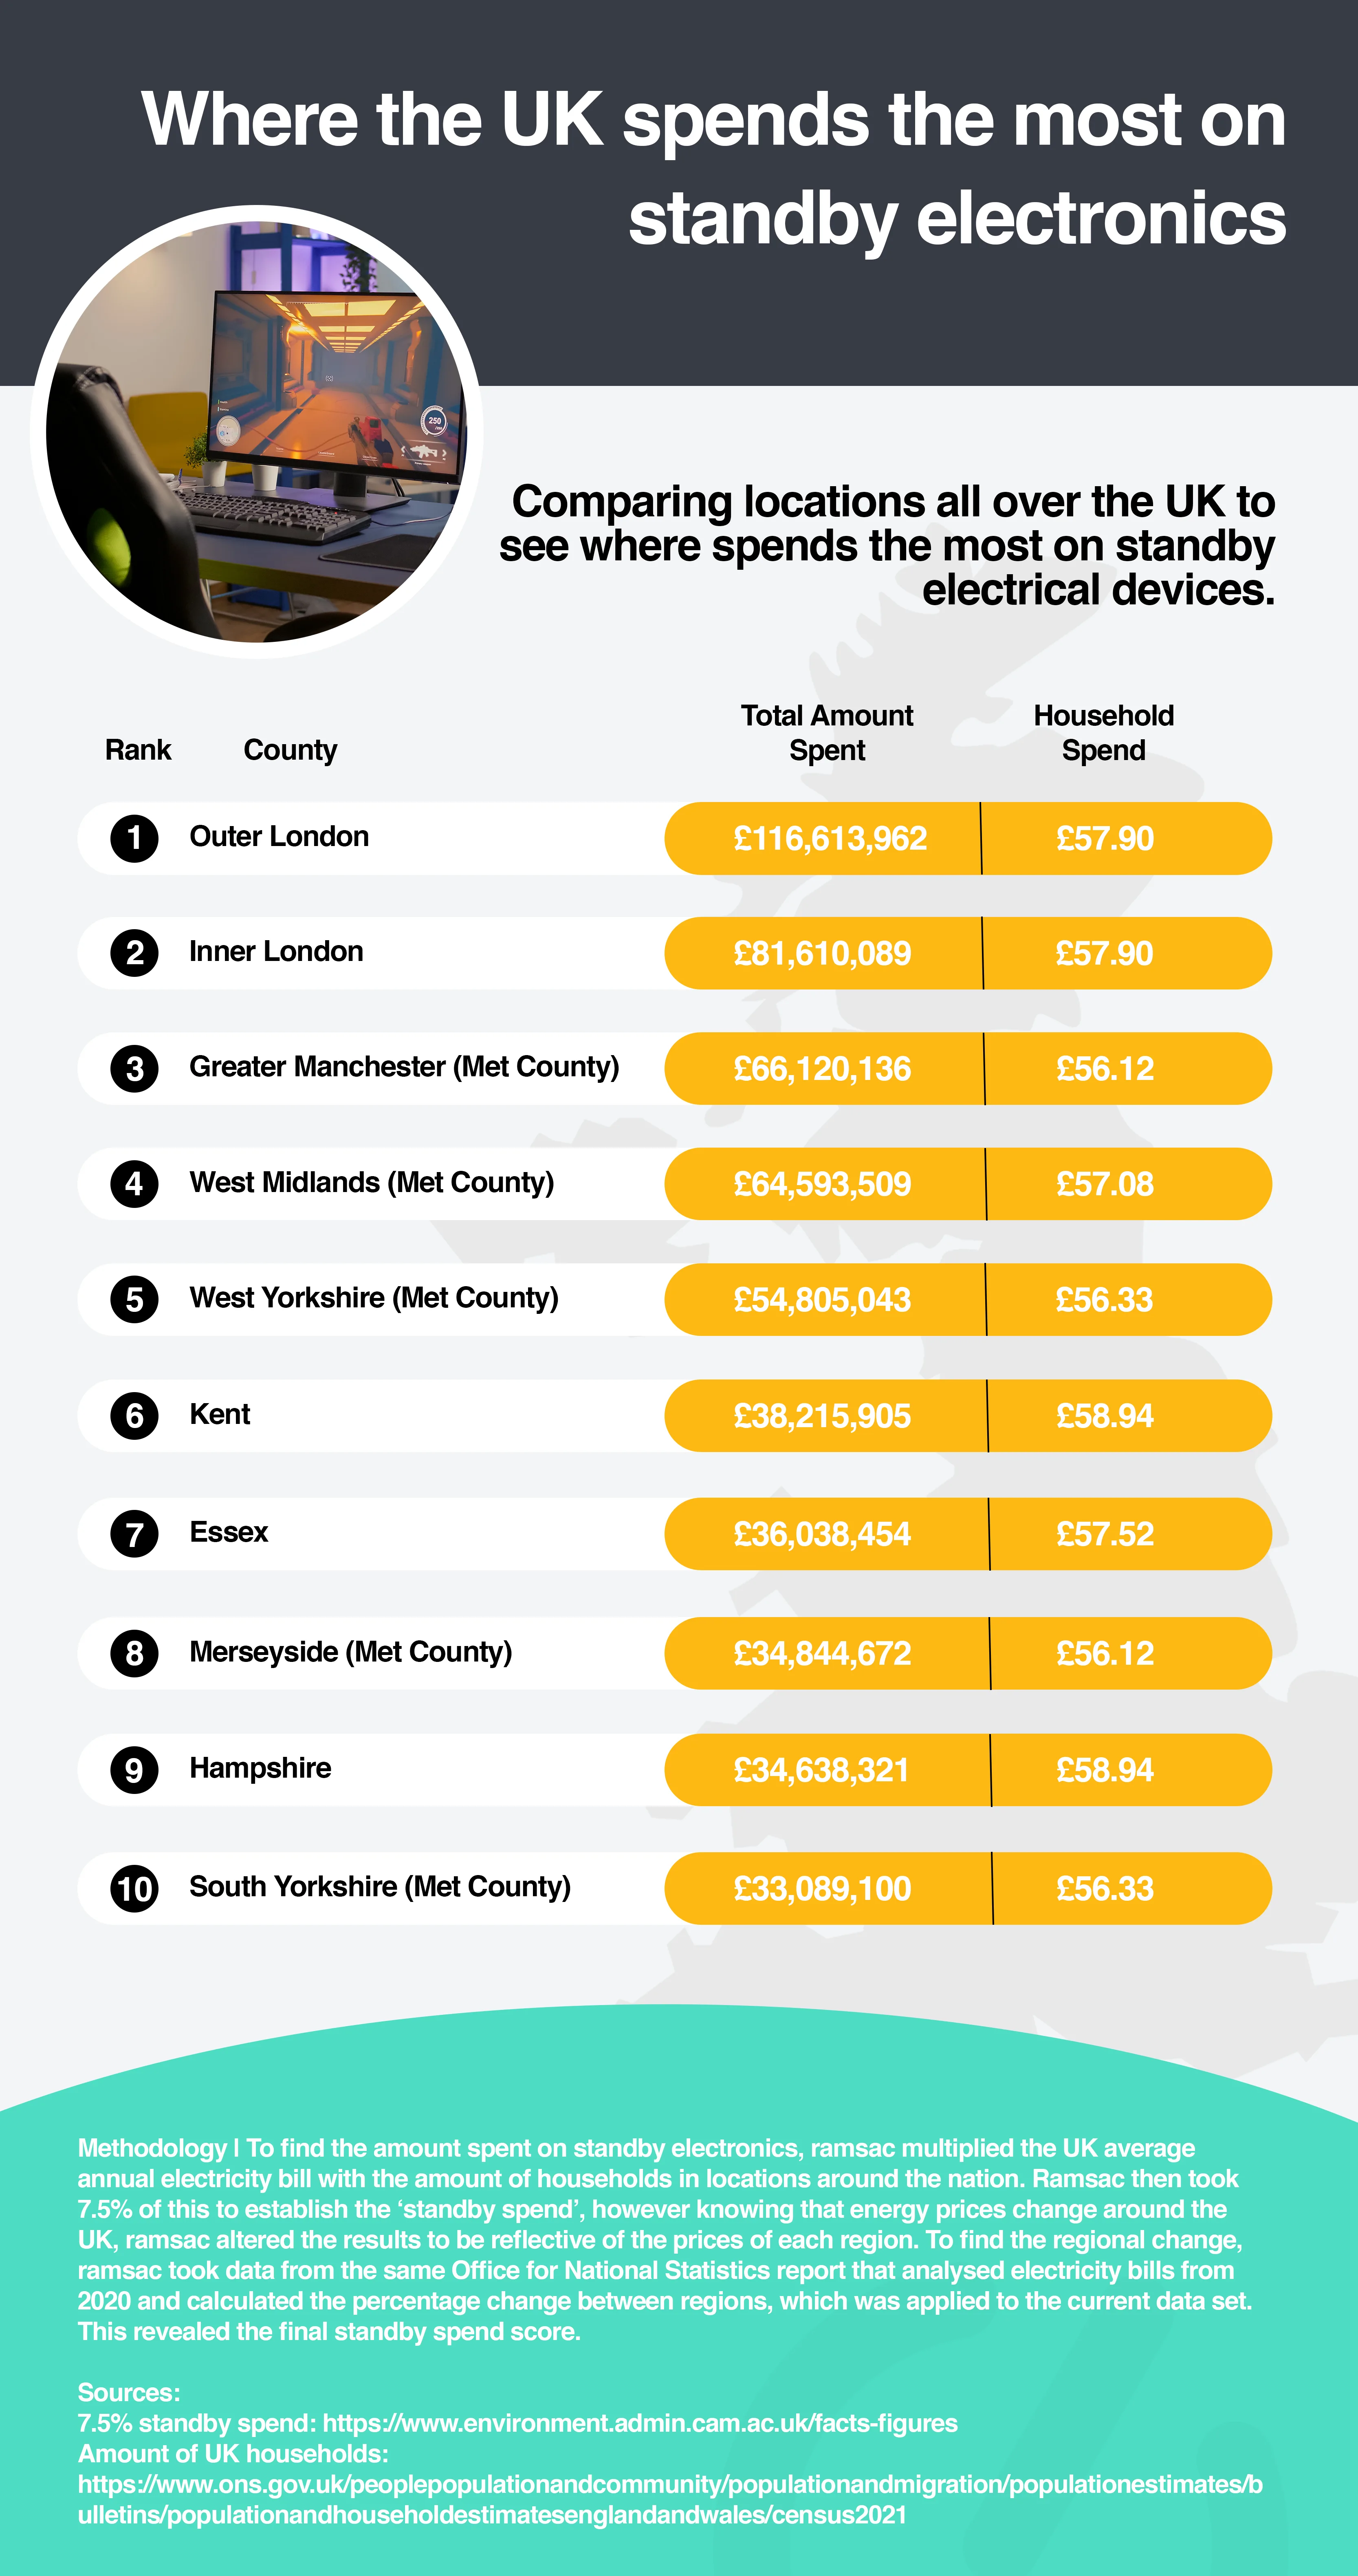
Comparatively to the number of households, the price of electricity in certain regions is still contributing to a significant collective energy bill. For example, despite Outer London having 20,000 less households than the East Midlands, Outer London collectively accrued a standby energy bill that cost £3m more.
Below is a breakdown of the UK, so you can see exactly how much locations all over the country compare, and where the hotspots are for standby spend.

Counties spending the most on standby electronics:
- Outer London: £116,613,962
- Inner London: £81,610,089
- Greater Manchester (Met County): £66,120,136
- West Midlands (Met County): £64,593,509
- West Yorkshire (Met County): £54,905,043
Counties spending the least on standby electronics:
- Rutland: £933,274
- Herefordshire: £4,725,937
- Shropshire: £7,967,884
- Northumberland: £8,286,059
- Dorset: £10,066,614
UK locations spending the most on standby electronics:
- Birmingham: £24,171,910
- Leeds: £19,237,252
- Sheffield: £13,068,938
- Manchester: £12,048,992
- Bradford: £11,824,009
UK locations spending the least on standby electronics:
- City of London: £283,690
- Richmondshire: £1,177,331
- Melton: £1,262,994
- Oadby and Wigston: £1,262,994
- Eden: £1,380,543
Where households spend the most on standby electronics:
- Devon: £59.46
- Gloucestershire: £59.46
- Cornwall: £59.46
- Wiltshire: £59.46
- Somerset: £59.46
How to reduce your standby electronics spend
It’s important to get into the habit of turning off electronics completely. In a year’s time, you could be contributing to a greener planet and more money in the bank.
Here are some handy money-saving tips to help you cut your standby spending:
- Use an extension cable to make it easier to turn multiple plugs off
- Switch off appliances after use, such as your microwave or coffee machine
- Set daily reminders for the end of each day to switch unnecessary electronics off
- Unplug electronics such as mobiles or laptops once the battery is full to prevent overcharging
Simple lifestyle changes each day can help to reduce yearly energy costs. Ensuring your electronics and appliances aren’t left on standby can help to bring bills down and can save you money immediately.
Methodology:
To find the amount spent on standby electronics, ramsac multiplied the UK average annual electricity bill with the number of households in locations around the nation. Ramsac then took 7.5% of this to establish the ‘standby spend’, however knowing that energy prices change around the UK, ramsac altered the results to be reflective of the prices of each region. To find the regional change, ramsac took data from the same Office for National Statistics report that analysed electricity bills from 2020 and calculated the percentage change between regions, which was applied to the current data set. This revealed the final standby spend score.
Sources Used:
7.5% standby spend: https://www.environment.admin.cam.ac.uk/facts-figures
Amount of UK households: https://www.ons.gov.uk/peoplepopulationandcommunity/populationandmigration/populationestimates/bulletins/populationandhouseholdestimatesenglandandwales/census2021


